Do you know for sure how many people Google is sending to your stores? Probably, if you have more than one store. That's because you can easily find the information by going to your Google My Business account and looking at the Insights for your store. There, you'll see requests for driving directions and Google Maps searches from the last 7, 30, or 90 days. Not hard.
But what happens if you have 5 stores? 50? 500? Chances are, no one in your organisation is sitting there loading page after page for each place and copying and pasting the data into a spreadsheet to find the answer. So, if your business is a chain or property of any size, you probably don't know.
How can you figure out how much Google is worth to your business without good data? How do you make choices about priorities that are well-informed? Should you take money and people away from other projects to clean up Google? Worse yet, what trends are you missing that could tell you important things about what marketing, sales, or communication methods to use?
The Missing Piece - Company Wide Insights
With the release of version 3.2 of Google's Google My Business API, it's finally possible to get company-wide insights by combining data from the different sites and comparing them to see which ones do better and why. Google also made it possible to gather data for up to 18 months, which made it possible to look at long-term trends for the whole company or just one location. This means that for the first time, companies can track foot traffic from online to offline without having to run a special campaign, deal, or use some other tracking method.
PinMeTo has just given their customers one of the first Google My Business Insights tools that can be used across an entire business. When combined with our publishing and tracking tools, these new insights give companies a clear picture of past totals, the best-performing locations based on a number of factors, and trends in the form of activity graphs.
Now, our clients can not only make sure that their buyers always find the right hours, address, and phone number, but they can also keep track of how often this happens.
Using Data to Know Where And When to Engage
PinMeTo will soon offer trend graphs that show data from the past 18 months for straight and indirect searches, requests for phone numbers, requests for driving directions, and Google Maps views. These trend graphs give useful information about how customers behave, which makes it easier to plan marketing activities and decide what kind of material to put on a website. Here are some examples of historical trends for different market segments that show exactly when customer activity spikes. This makes it possible to do a thorough study of customer behaviour and plan marketing and communication strategies.
See if you can decide which sort of company is represented below just looking at the data trends. The answers will be in the captions.
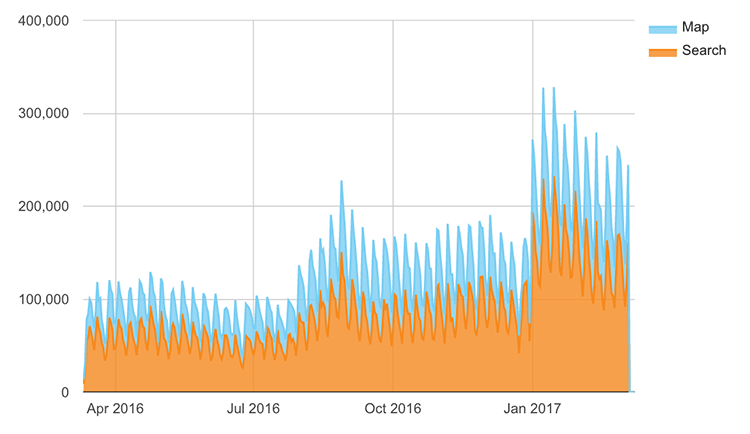

Everyone knows about New Year's plans, and it's not unusual for people to put their health at the top of their list of goals. Here's the proof. It's also a strong sign that late November/early December may be a good time to push local advertising campaigns, since searches for directions to nearby gyms are going up.
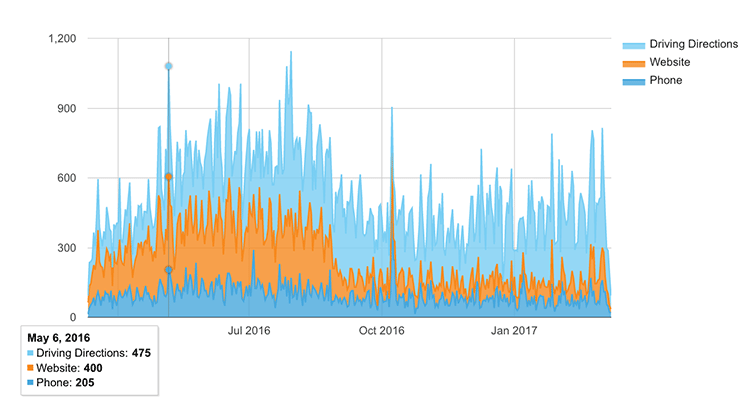 Again, the information above explains worth more than it shows anything new. In this case, a company could think about whether adding outdoor seating to more places would be a good investment based on the fact that more people visit venues with outdoor seating in the summer.
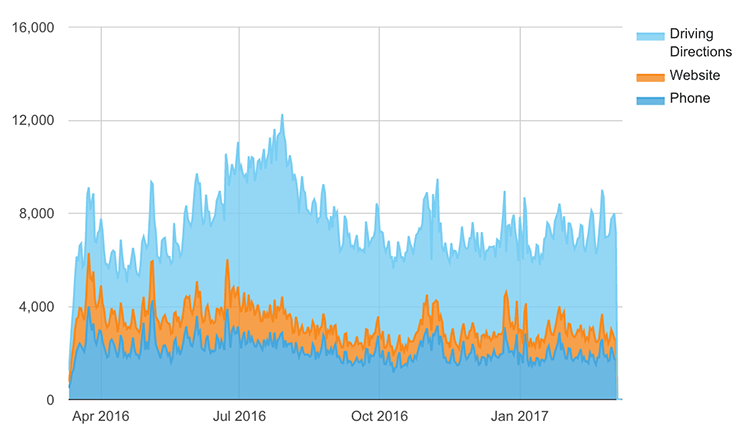

The data above supports the idea that customers on vacation are using mapping services to find a gas station brand that they trust. This could lead the brand to capitalize on customers visiting new locations with a check in campaign or a photo contest to take advantage of customers vacation pictures to drive organic views across social media.
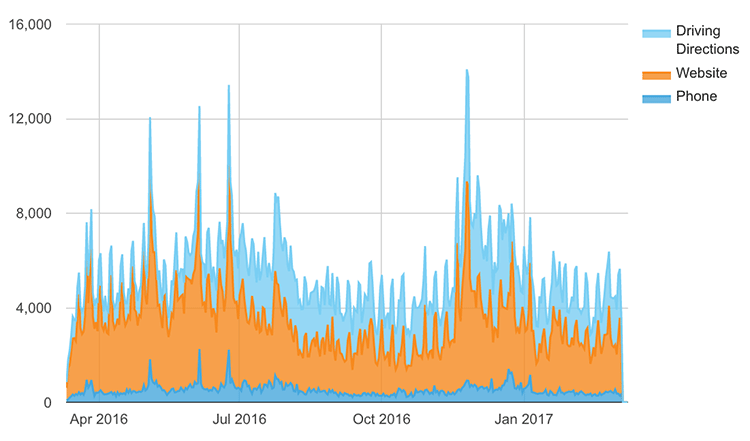

Before big holidays, there are more people looking for directions and going to websites. This could mean that this home improvement chain should push sales and deals on social media and market locally, since customers are looking for nearby stores. 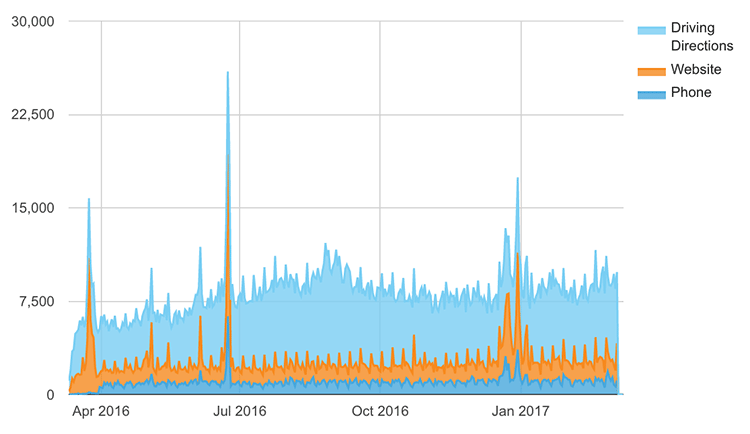
Last but not least, this grocery store can use historical data about customer activity before big holidays to plan marketing activities at specific times to really take advantage of how people already act. Holiday deals, flyers, social media campaigns, or other forms of marketing done before these peaks could drive sales even higher.
PinMeTo: Trust Your Data, Understand Your Customers
There has never been a better time for chains and brands with multiple locations to take control of their online presence. With PinMeTo and Google's new API, you can finally have control, tracking, and insights for your whole company in one place. Now you can know for sure how your company does on Google both on the company and each-location level, being sure that the branding and information your customers find is right and up-to-date. Now that you have more power and better information, the question is not whether you can afford to prioritise Google, but whether you can afford not to.Reviewed: August 11, 2023

.png?width=600&name=Googles-WhatsApp-and-SMS-Integration-with-Business-Profiles%20(1).png)